关于博客访问请求数据可视化解决方案
2024年6月17日
本文介绍了如何使用AWS CloudFront访问日志、Athena和Grafana等工具,实现博客访问请求数据的可视化解决方案。
前置条件
本博客最初是参考 guangzhengli 大佬的如何 30 分钟搭建一套完整独立博客文章搭建的。这篇文章已经有了博客网站数据统计的解决方案,但是数据不在AWS,玩转性不高。
在博主将博客从Github Page迁移到AWS S3并启用了CloudFront加速后,博客文章的访问数据全部在AWS了,所以就在思考如何自己实现博客访问请求数据的可视化解决方案。
方案架构
博客网站的访问数据全部依托于AWS CloudFront的standard logs功能,CloudFront会将访问日志写入到S3中,我们可以通过Athena查询这些日志,然后通过Grafana展示出来,整体架构如下:

技术实现
配置CloudFront
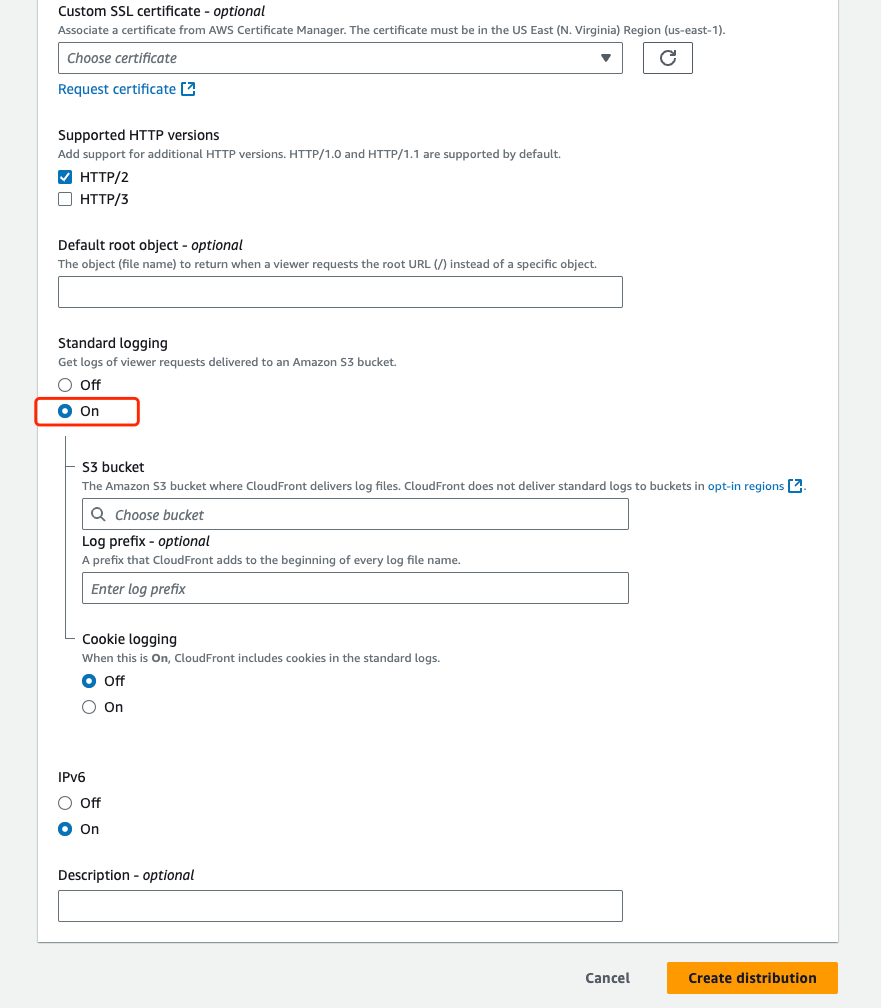
首先需要在创建CloudFront中启用访问日志,将访问日志写入到S3中。在CloudFront中选择Distribution,找到Logging配置,选择Bucket和Prefix,如下图所示:

创建Athena表
根据cloudfront log中字段创建Athena table
CREATE EXTERNAL TABLE `cloudfront_logs`(
  `date` date,
  `time` string,
  `x_edge_location` string,
  `sc_bytes` bigint,
  `c_ip` string,
  `cs_method` string,
  `cs_host` string,
  `cs_uri_stem` string,
  `sc_status` int,
  `cs_referrer` string,
  `cs_user_agent` string,
  `cs_uri_query` string,
  `cs_cookie` string,
  `x_edge_result_type` string,
  `x_edge_request_id` string,
  `x_host_header` string,
  `cs_protocol` string,
  `cs_bytes` bigint,
  `time_taken` float,
  `x_forwarded_for` string,
  `ssl_protocol` string,
  `ssl_cipher` string,
  `x_edge_response_result_type` string,
  `cs_protocol_version` string,
  `fle_status` string,
  `fle_encrypted_fields` int,
  `c_port` int,
  `time_to_first_byte` float,
  `x_edge_detailed_result_type` string,
  `sc_content_type` string,
  `sc_content_len` bigint,
  `sc_range_start` bigint,
  `sc_range_end` bigint)
ROW FORMAT DELIMITED
  FIELDS TERMINATED BY '\t'
STORED AS INPUTFORMAT
  'org.apache.hadoop.mapred.TextInputFormat'
OUTPUTFORMAT
  'org.apache.hadoop.hive.ql.io.HiveIgnoreKeyTextOutputFormat'
LOCATION
  's3://logs.hui61.com/'
TBLPROPERTIES (
  'skip.header.line.count'='2',
  'transient_lastDdlTime'='1707099337')
配置Grafana
创建AWS User
在AWS中创建User,给予Athena和S3的访问权限,获取Access Key和Secret Key。
{
    "Version": "2012-10-17",
    "Statement": [
        {
            "Sid": "AthenaQueryAccess",
            "Effect": "Allow",
            "Action": [
                "athena:ListDatabases",
                "athena:ListDataCatalogs",
                "athena:ListWorkGroups",
                "athena:GetDatabase",
                "athena:GetDataCatalog",
                "athena:GetQueryExecution",
                "athena:GetQueryResults",
                "athena:GetTableMetadata",
                "athena:GetWorkGroup",
                "athena:ListTableMetadata",
                "athena:StartQueryExecution",
                "athena:StopQueryExecution"
            ],
            "Resource": [
                "*"
            ]
        },
        {
            "Sid": "GlueReadAccess",
            "Effect": "Allow",
            "Action": [
                "glue:GetDatabase",
                "glue:GetDatabases",
                "glue:GetTable",
                "glue:GetTables",
                "glue:GetPartition",
                "glue:GetPartitions",
                "glue:BatchGetPartition"
            ],
            "Resource": [
                "*"
            ]
        },
        {
            "Sid": "AthenaS3Access",
            "Effect": "Allow",
            "Action": [
                "s3:GetBucketLocation",
                "s3:GetObject",
                "s3:ListBucket",
                "s3:ListBucketMultipartUploads",
                "s3:ListMultipartUploadParts",
                "s3:AbortMultipartUpload",
                "s3:PutObject"
            ],
            "Resource": [
                "arn:aws:s3:::logs.hui61.com"
            ]
        },
        {
            "Sid": "AthenaExamplesS3Access",
            "Effect": "Allow",
            "Action": [
                "s3:GetObject",
                "s3:ListBucket"
            ],
            "Resource": [
                "arn:aws:s3:::athena-examples*"
            ]
        }
    ]
}
创建Grafana Data Source
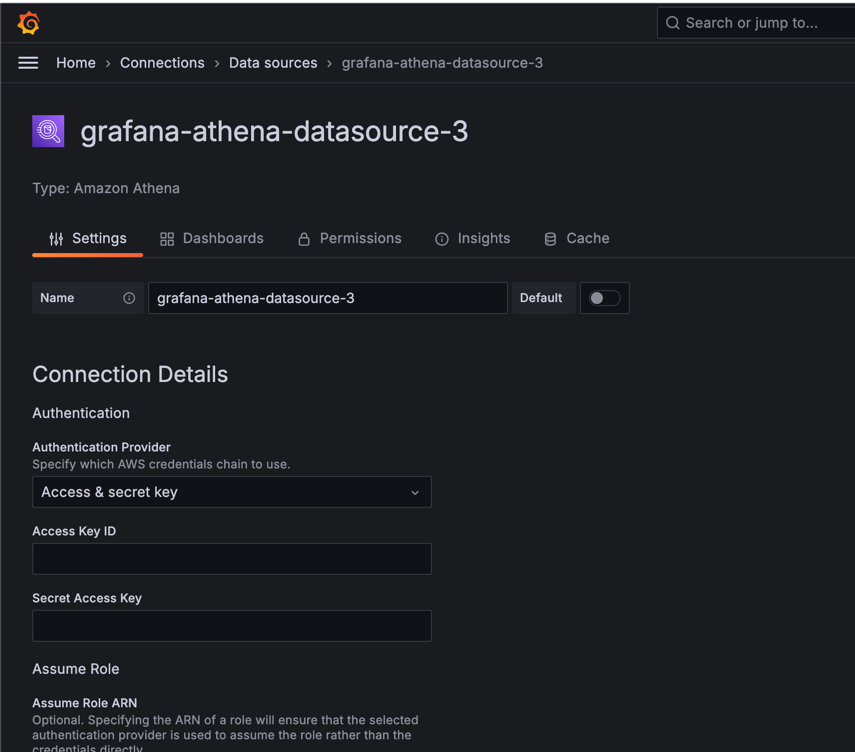
使用上一步创建的Access Key和Secret Key,创建Grafana Data Source,选择Athena,填写Region、Access Key、Secret Key.

创建Grafana Visitor Number Panel
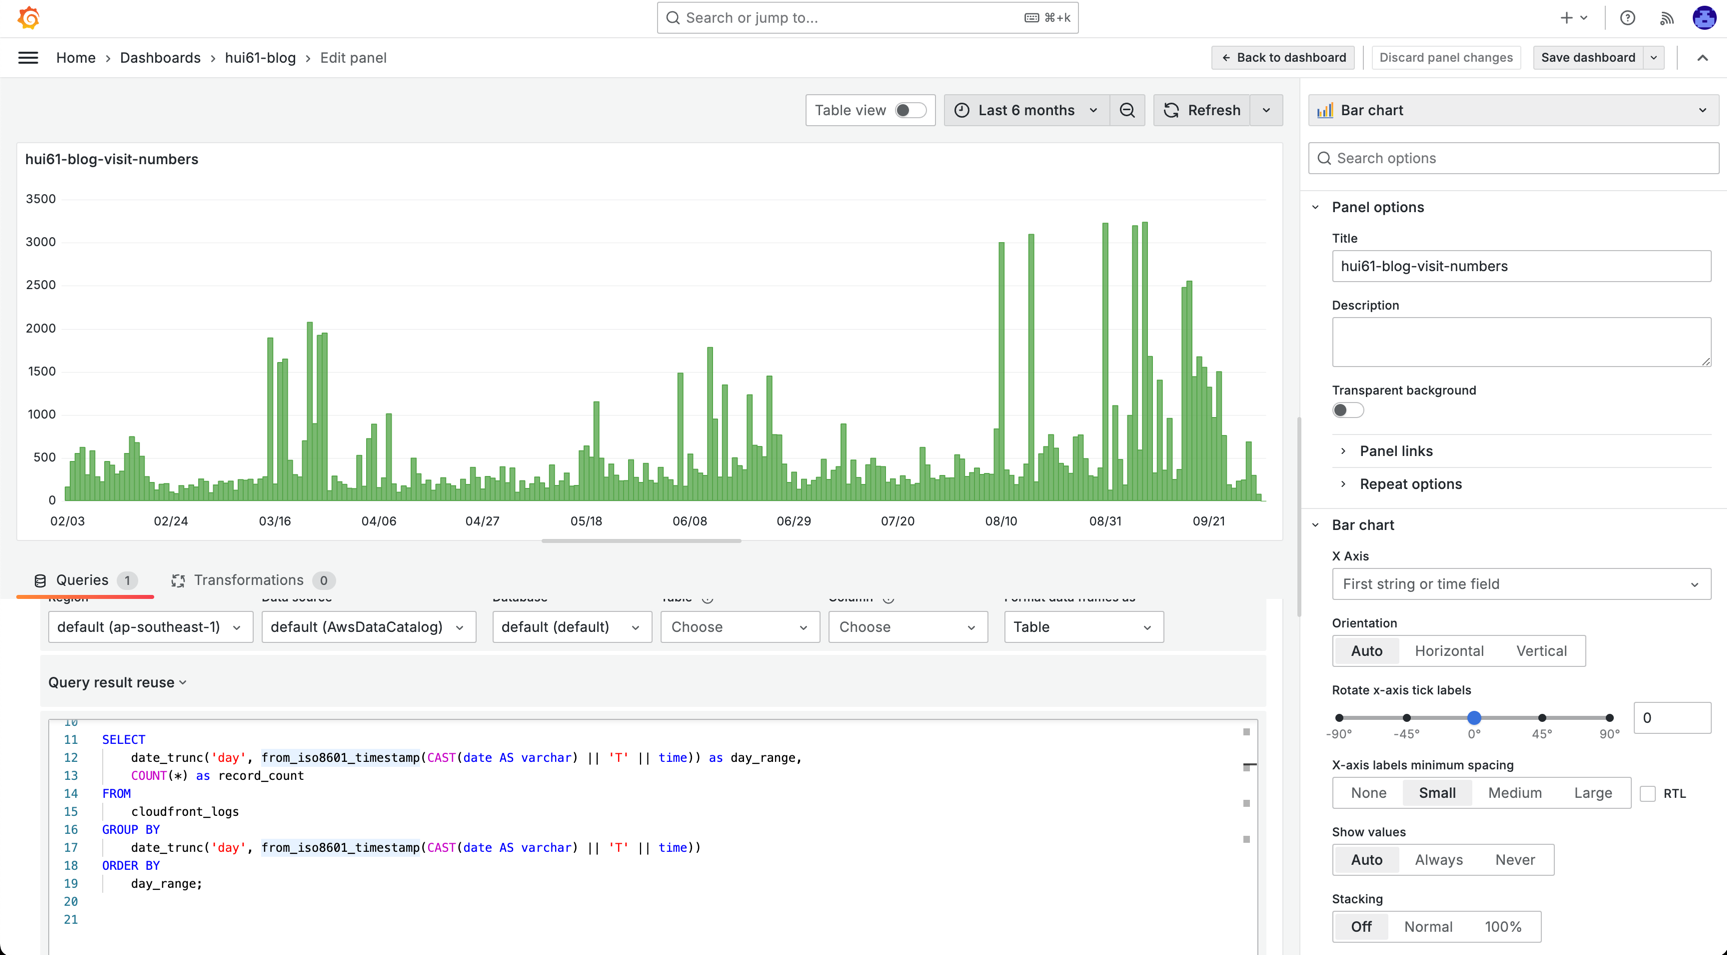
创建visitor number panel,其中Data Source选择Athena Data Source,图表类型选择Bar Chart,填写Athena Query
SELECT
    date_trunc('day', from_iso8601_timestamp(CAST(date AS varchar) || 'T' || time)) as day_range,
    COUNT(*) as record_count
FROM
    cloudfront_logs
GROUP BY
    date_trunc('day', from_iso8601_timestamp(CAST(date AS varchar) || 'T' || time))
ORDER BY
    day_range;
配置好之后点击查询按钮,并继续配置相关图表属性,最终效果如下图所示:

创建Grafana Visitor location Panel
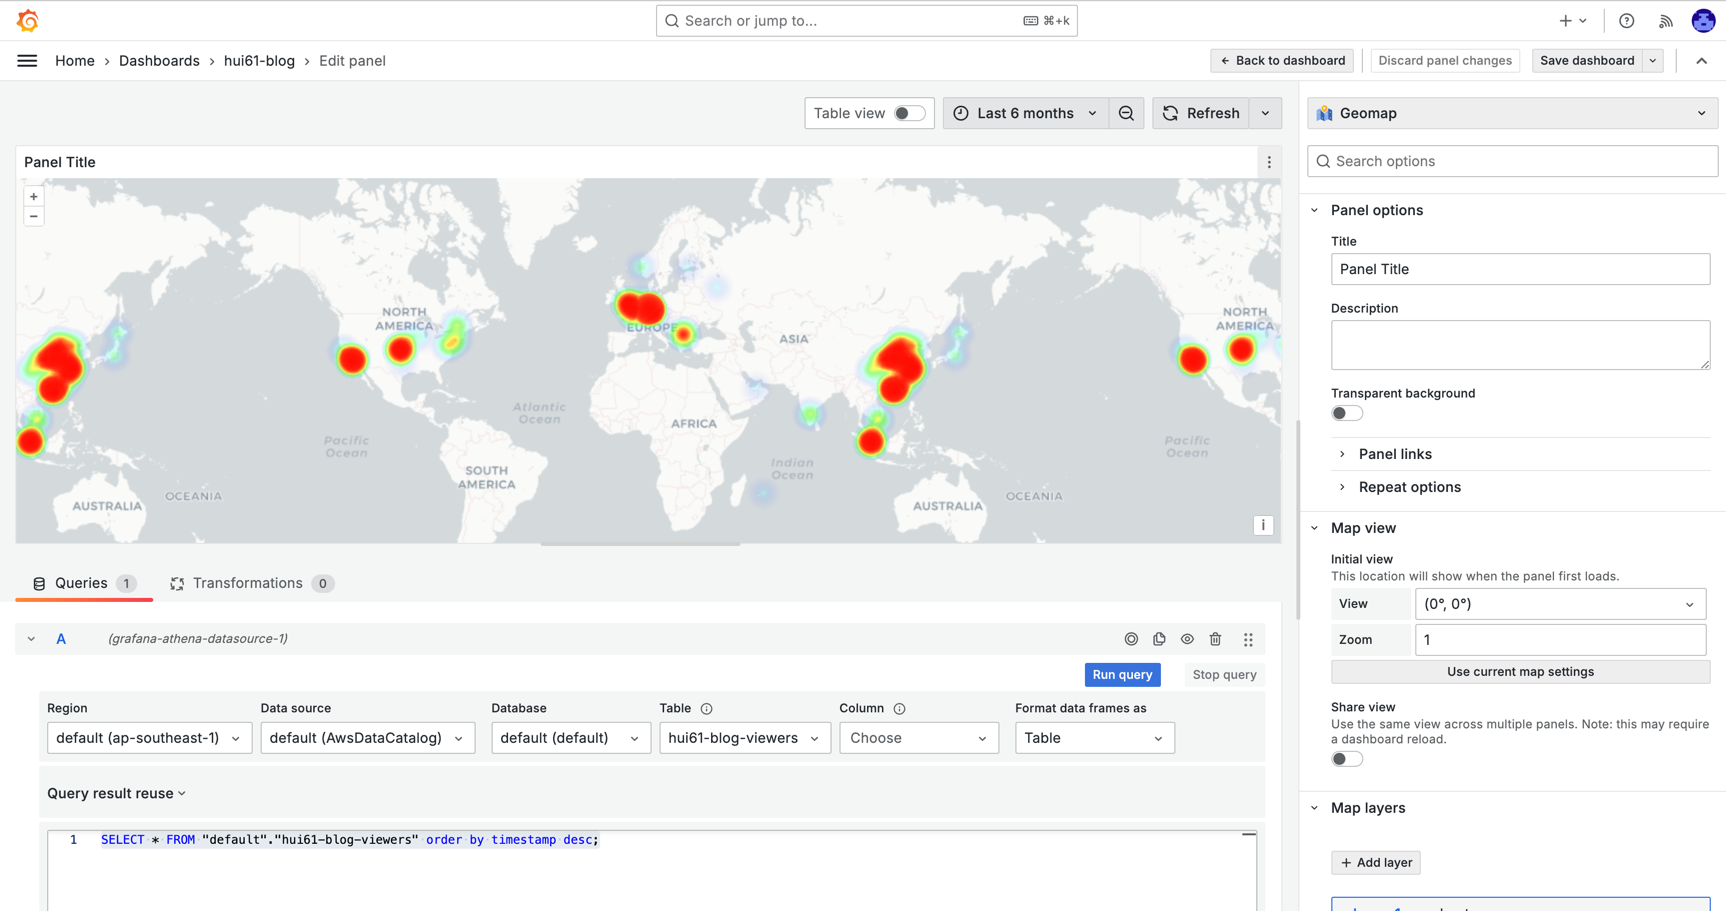
创建visitor location panel,其中Data Source选择Athena Data Source,图表类型选择Geomap,填写Athena Query,其中hui61-blog-viewers table需要有longitude和latitude字段,可以根据Cloudfront文档配置Request Header
SELECT * FROM "default"."hui61-blog-viewers" order by timestamp desc;
配置好之后点击查询按钮,并继续配置相关图表属性,最终效果如下图所示:

问题
目前Grafana Cloud中Dashboard不支持public访问,需要登录Grafana Cloud才能访问,如果需要public访问,可以考虑使用Grafana on EC2或者其他方式。
参考资料
- https://docs.aws.amazon.com/AmazonCloudFront/latest/DeveloperGuide/distribution-web-values-specify.html#DownloadDistValuesLoggingOnOff
- https://docs.aws.amazon.com/AmazonCloudFront/latest/DeveloperGuide/AccessLogs.html
- https://docs.aws.amazon.com/AmazonCloudFront/latest/DeveloperGuide/adding-cloudfront-headers.html#cloudfront-headers-viewer-location